Has the S&P 500 Lost Its Diversification Edge?
As of early 2024, the top ten stocks in the S&P 500 make up over 37% of its total market capitalization—a record high, according to Morningstar (2024). While the index is widely viewed as a representation of the entire U.S. stock market, this level of concentration invites scrutiny. Can a benchmark so heavily weighted toward a handful of companies still be considered diversified?
It’s a common belief: buying an S&P 500 index fund means owning a slice of the whole economy. But since the index assigns weight based on market cap—not equally across its 500 names—the largest companies wield disproportionate influence. This article breaks down how that structure can distort diversification, especially when particular sectors experience rapid growth or sharp declines.
Summary Points
- Over one-third of the index’s weight sits in just ten companies, creating an imbalance.
- Tech and communication services now steer much of the index’s returns.
- Market-cap weighting naturally favors outperformance, amplifying dominant stocks.
- Company count alone doesn’t equal risk balance—true diversification considers volatility contributions.
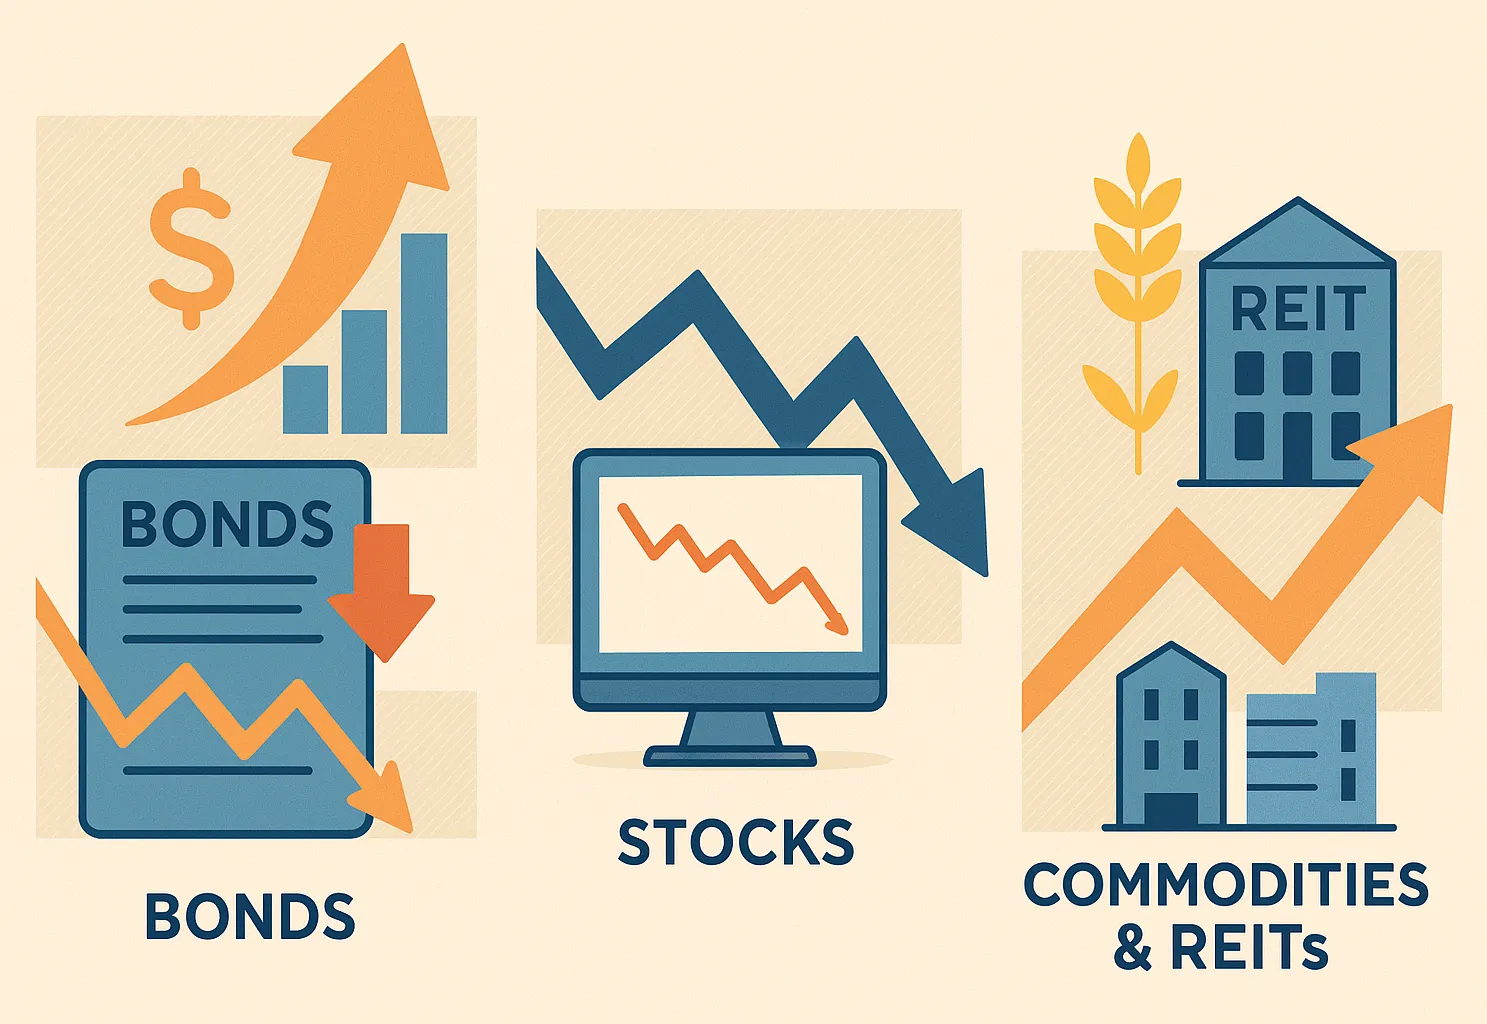
- Some investors may explore supplementing the S&P 500 with different weighting styles or asset classes.
Where Risk Accumulates Quietly
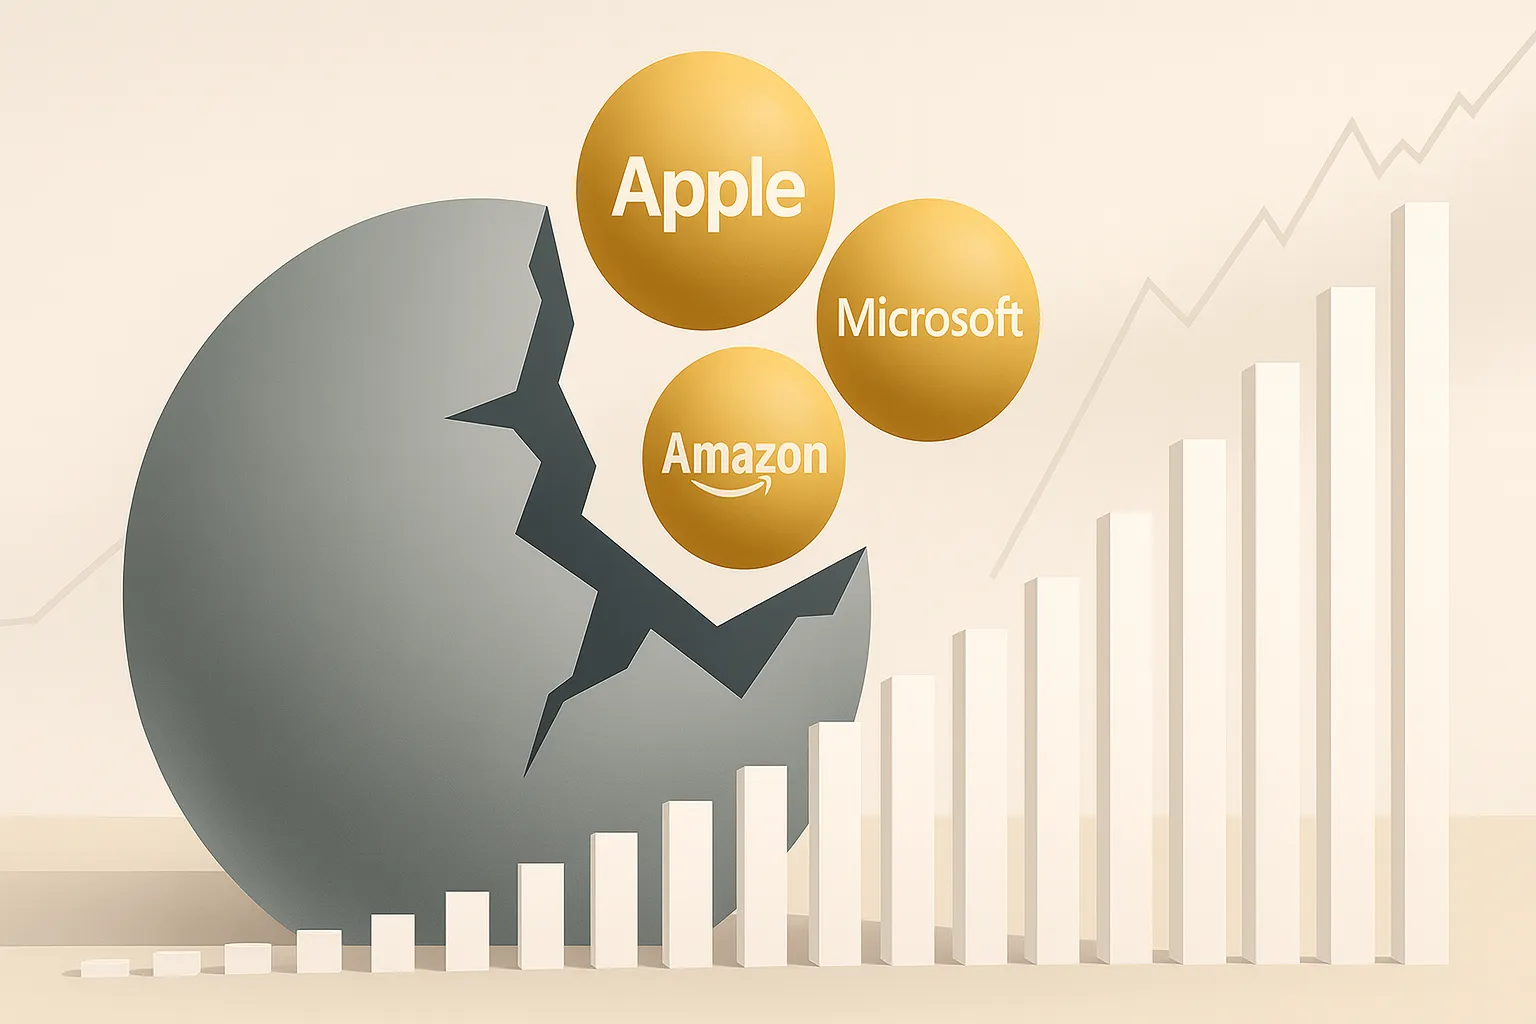
The S&P 500 may list 500 companies, but due to its design, just a few dominate its makeup. By the close of 2024, five stocks—Apple, Nvidia, Microsoft, Amazon, and Alphabet—made up nearly 29% of the index. The top ten collectively represented about 37%.
A person holding a broad market ETF might assume they’re diversified. But under the hood, they’re significantly exposed to the fortunes of a few large-cap tech firms. Should these names falter, the investor’s total equity exposure could suffer—regardless of the performance of the remaining 490+ holdings.
When Tech Takes Over (Again)
This isn’t the first time technology has taken center stage. Back in 2000, during the dot-com boom, tech stocks made up around 33% of the S&P 500’s value. After the bubble burst, it took nearly seven years for the index to return to its prior peak.
Fast forward to today, and enthusiasm around AI has once again lifted tech to outsized levels of dominance. While innovation can fuel growth, history shows that extreme concentration can become a liability—particularly if market sentiment shifts or policy landscapes change.
The concern: relying entirely on a cap-weighted index during these moments can leave investors vulnerable to repeating old mistakes—overweighting hot sectors at the wrong time.
What Market-Cap Weighting Really Means
In a market-cap-weighted index like the S&P 500, winners get stronger:
- As certain stocks rise, their index weight increases
- That draws more passive investment into those names
- Momentum builds—until it breaks
This dynamic worked in bull runs, but in pullbacks, it can deepen losses. Consider 2022: the S&P 500 fell over 18%, while the tech-focused Nasdaq sank more than 30%. Exposure to tech—while indirect—still hurts passive S&P investors.
Concentration as a Feature, Not a Bug
Some market observers don’t see the S&P 500’s concentration as a weakness. Instead, they view it as an intentional outcome of how the index is built. By weighting companies based on market cap, the index continually shifts toward firms that are outperforming—effectively acting as a built-in filter for market leadership.
As older or underperforming companies drop in influence, they’re gradually replaced by stronger, more innovative players. In this light, the S&P 500 isn’t flawed—it’s structured to follow where value and momentum are naturally flowing. For long-term investors, this can be a practical way to stay aligned with the most dominant businesses in the U.S. market.
How to Examine True Diversification
A broad ticker symbol and a long list of holdings may not provide balanced risk. What matters more is risk contribution—how much each position drives overall portfolio volatility.
Some investors may consider:
- Equal-weight versions of the S&P 500
- Multi-factor ETFs that reduce dependence on momentum
- Broader diversification via international stocks or alternative asset classes
These choices aim to avoid excessive reliance on a single sector or group of stocks.
One Simple Adjustment: Rebalancing
Even basic portfolio maintenance—such as setting a maximum weight per holding (e.g., 5%) or performing an annual rebalance—can help correct drift before it becomes a problem. Behavioral tendencies, like letting strong performers grow unchecked, often lead to risk creep without investors realizing it.