Your Portfolio Returns Are Wrong—Here’s How to Fix It
You might think your portfolio is up 10%—but is it really? Research shows that many retail investors tend to overestimate their actual performance due to overconfidence and failure to account for fees and timing. A 2022 study published in the Journal of Informatics Education and Research found that individual investors often miscalculate investment decisions due to cognitive biases and lack of proper return tracking, leading to significant performance gaps. A separate study by Morningstar found that in sector equity funds, investors earned an average annual return of 6.4% — a full 4.4% less than the funds themselves delivered—mainly due to poor timing decisions—highlighting the gap between perceived and real investment outcomes.
If you're not accounting for things like fees, deposits, when you made trades, or even which type of return you’re using, your results might be telling a skewed story. Let’s fix that, together.
In this guide, we’ll walk you through how to accurately measure your portfolio’s performance, break down the differences between time-weighted and money-weighted returns, and give you the inside scoop on how the pros handle this stuff—so you can truly know how you’re doing.
Key Takeaways
- Many people calculate their portfolio returns incorrectly.
- There are two main methods: Time-Weighted Return (TWR) and Money-Weighted Return (MWR).
- Real returns should factor in fees, cash flows, taxes, and timing.
- You can use Excel dashboard to make this easier.
What’s the Problem With the Way Many People Calculate Returns?
Let’s say you started the year with $10,000 and added $5,000 in June. By December, your portfolio is worth $16,500.
Many people look at that and go:
"I invested $15,000 and now I’ve got $16,500. That’s a 10% return."
Seems simple enough, right? But that’s not actually accurate. Why? Because it completely ignores when you added that $5,000.
If the markets were low in June, maybe you got a great entry price and made more than you think. If they were high, maybe that extra investment didn’t do much. This is where TWR and MWR come in.
To better understand the difference between these two approaches, check out the visual below.
It shows how Time-Weighted Return and Money-Weighted Return each measure performance from different perspectives—depending on what question you're trying to answer.
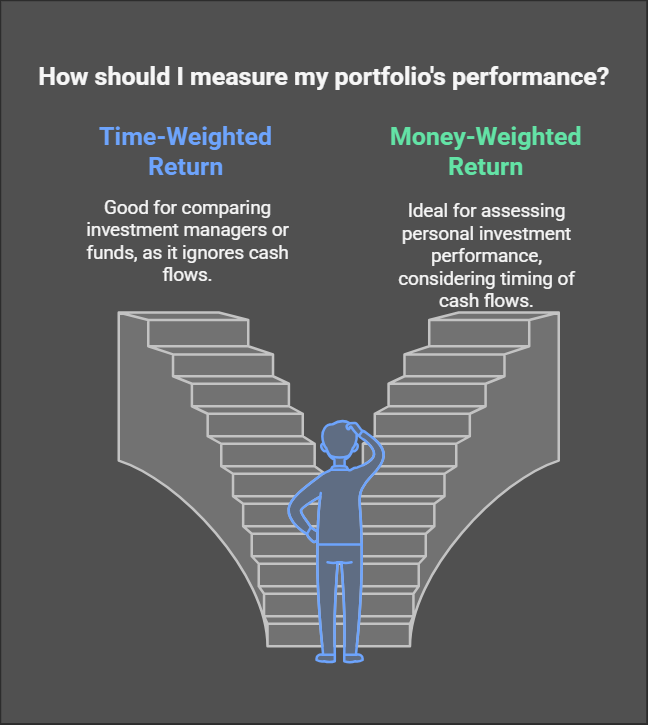
Time-Weighted Return (TWR): What It Measures
Comparing investment managers or funds.
TWR tells you how your investments performed without factoring in your deposits or withdrawals. It’s objective and great for evaluating performance without the noise.
Hypothetical Example:
Let’s say:
- Jan–Jun: Your $10,000 grows to $12,000 (+20%).
- You add $5,000 in June (now you have $17,000).
- Jul–Dec: Total value ends at $16,500 (a slight loss of ~ -2.9%).
TWR formula:
(1 + 0.20) × (1 - 0.029) - 1 = 16.52% total return
That’s the true performance of your investments—ignoring when you added money.
Money-Weighted Return (MWR): What It Measures
Measuring your personal investing performance.
MWR (aka IRR) includes the timing of your deposits and withdrawals. It shows how your decisions impacted your actual return.
Using the same numbers:
- $10,000 invested in January
- $5,000 added in June
- End of year: $16,500
At a glance, it might seem like a 10% return. But when you account for when the $5,000 was added, the actual return is different.
Using a real calculation (via Excel or Google Sheets), your MWR is about 11.67%. That’s your personal rate of return—how your money actually grew based on when it was invested.
Here’s how that’s structured:
The MWR is calculated by solving the internal rate of return that sets the net present value of all cash flows to zero. In Excel or Sheets, you'd use:
=XIRR(values, dates)
Solving this gives ~11.70%, which reflects the impact of the timing—not just the total you invested.
So while your portfolio’s performance (TWR) was 16.2%, your personal return (MWR) was only ~11.70%, based on when you contributed.
Why This Matters
Let’s say you’re comparing yourself to the S&P 500. If you only look at TWR, you might think you beat the market—when really, your timing choices (MWR) tell a different story.
Knowing both:
- Helps you assess whether you’re making smart timing decisions.
- Lets you judge your financial advisor or fund fairly.
- Gives a clearer view of how your money’s actually growing.
Don’t Forget Fees, Taxes, and Risk
Even if your return math is spot-on, don’t ignore the details that quietly eat away at your performance:
- Fees (advisory, platform, transaction, fund expense ratios)
- Taxes on capital gains or dividends
- Risk—you want to know if you're taking on more risk for the same return
For context: Two portfolios might both return 8%, but one might be on a rollercoaster ride while the other is smooth sailing. Pros look at things like volatility and Sharpe Ratio to understand that.
Tools to Calculate Returns
You don’t need to be a math wizard to get this right.
Excel (for MWR):
Use the XIRR function:
=XIRR(values, dates)
- List cash flows: deposits as negatives, withdrawals or end value as positives
- Match them to dates
Excel (for TWR):
- Break the timeline into segments between cash flows
- Measure sub-period returns
- Multiply them together:
(1 + r1) × (1 + r2) × ... × (1 + rn) - 1